project writeup · october 2026 · 7 min read
Football greeks: pricing NFL yardage contracts by simulating the game one snap at a time
Kalshi lists contracts like “Pittsburgh gains 350+ total yards.” I built a model that plays out the rest of a game from any real in-game state, thousands of times, so every contract gets a price and a set of Greeks at every snap. Then I checked it against the market.
The problem
A contract that pays $1 if a team finishes over K yards is worth the probability that it does. That probability moves on every play, and it depends on three things: how many more plays the team will run (clock, score, possession), what kind of plays (a team that’s behind passes), and how many yards each play gains. Yards per play are lumpy: 39% of passes gain exactly zero, the right tail is long, and nothing can go past the goal line. No closed-form formula handles all of that, so the model simulates.
The model
Each snap is one step of a marked point process:
- Play call. A small network picks run, pass, punt, field goal, kneel or spike from the game state.
- Outcome. A mixture density network gives the probability of seven outcome classes (completion, incompletion, sack, interception, fumble and so on) and a mixture of eight discretized distributions over yards. Probability past the goal line becomes a touchdown.
- Pace. A third network draws how much clock runs before the next snap. An incompletion stops the clock; a run in bounds takes about 35 seconds.
- Rules. Downs, scores, possession changes, halftime and overtime are plain code, not a model.
Training is on seasons up to 2022, choices are made on 2023, and 2024–25 is reported once. On held-out plays the network beats a smoothed empirical model (2.8476 vs 2.8579 nats per play, about 13 standard errors) and a parametric one (2.8850). Over a whole game most of that gain washes out. Pace, play calling and game-to-game variation matter more than per-play precision.
Two fixes were needed before the whole-game numbers were calibrated. Simulated totals were 15–18% too narrow until each team got a per-game efficiency shock, and the league slowed down in 2024–25, so the clock speed is rescaled each week from games already played.
The Greeks
Yards gained so far never feed back into how the game is played, so one batch of simulations prices every strike at once, and delta and gamma come out of the same sample. Theta and vega need a second batch, paired on the same random numbers so the difference isn’t swamped by noise. Every Greek is reported with a standard error.
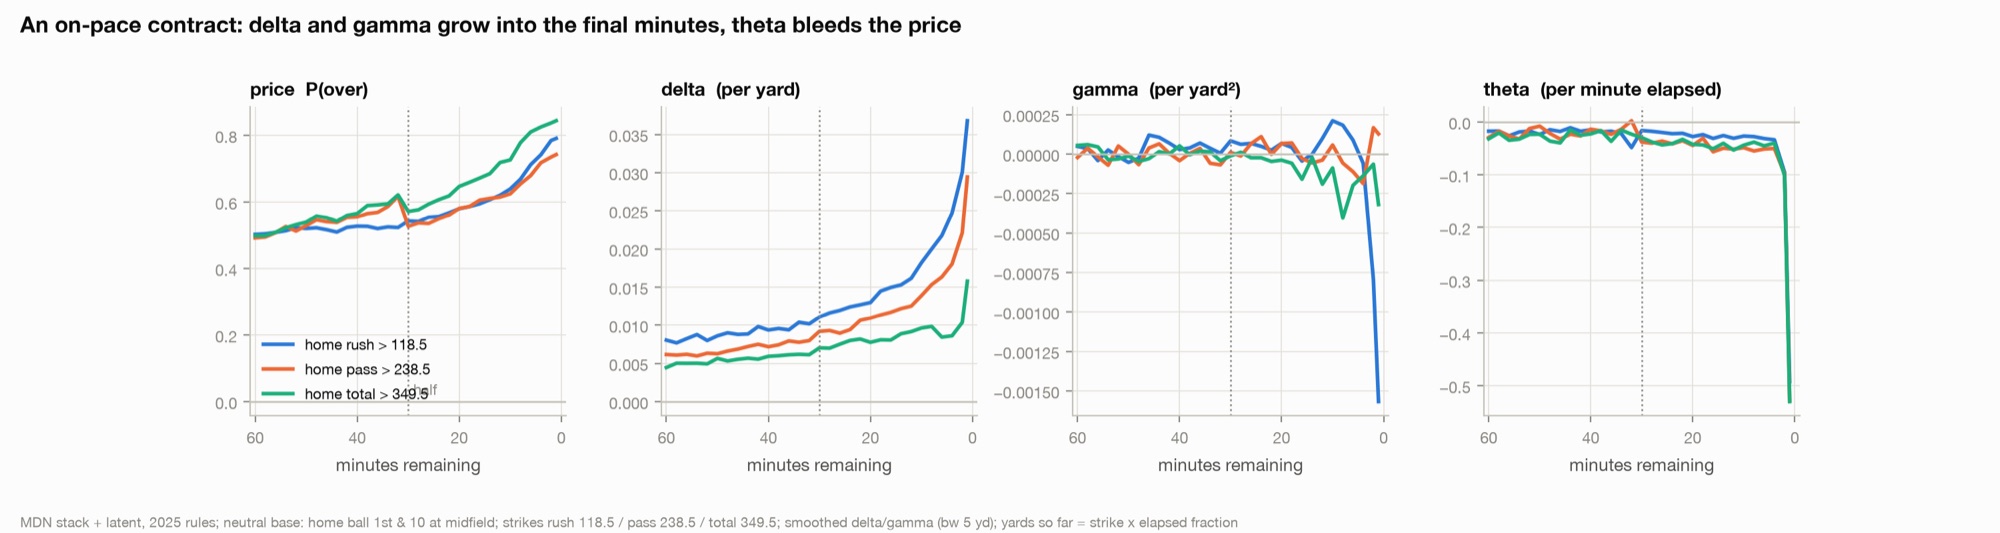
The behavior looks like an exotic option on a counting process. A lead makes the rushing over expensive and the passing over cheap. Tempo (plays per minute) is the risk factor that matters: its vega is always positive and large, while volatility vega is small and changes sign.
As a cross-check I fitted a small neural SDE to the simulator and took its Greeks by autograd. They agree with the Monte Carlo Greeks within error while more than 15 minutes remain. Near the strike in the final minutes every smooth model misses the gamma spike that discrete snaps create.
Against Kalshi
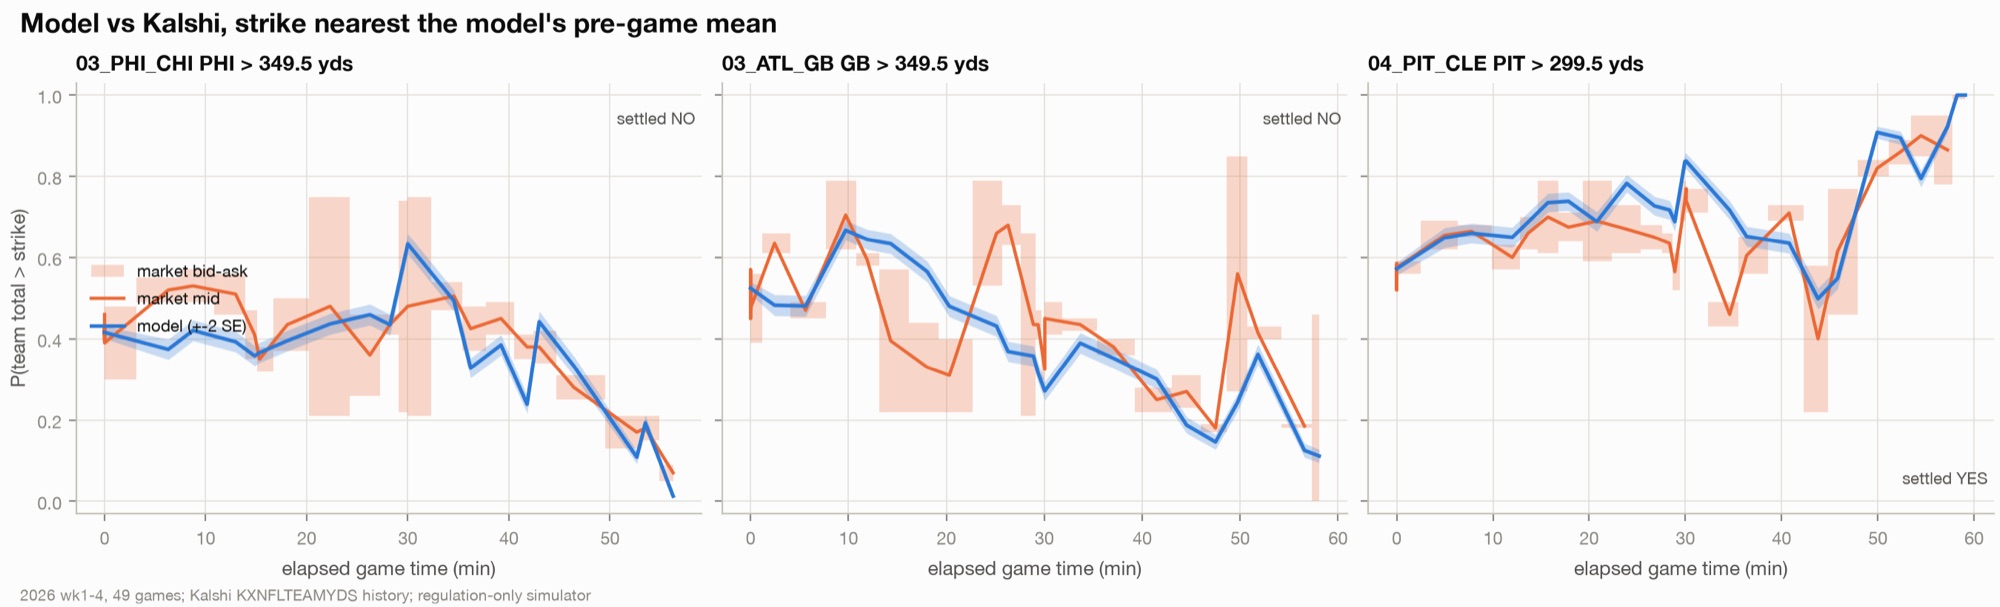
- Team totals. Kalshi only lists team total yards, and the books are thin. A trading rule fixed before any P&L was computed, crossing the spread and paying the taker fee, made about $0.12 per contract over 49 games on minute candles. Picking a random side on the same trades loses money.
- Live recordings. On 16 games recorded with real top-of-book quotes and sizes, the same rule with a one-minute fill delay made $0.05 per contract (95% CI −0.03 to +0.13). That’s too few games to confirm or reject the candle result, and the quotes that trigger trades often vanish within a minute.
- Player props. On liquid QB passing markets the model and the market are statistically tied. A second player model (injury reports, active rosters, game script, in-play updates) cut the market’s lead on rushing and receiving by about 60%, but the market is still better and no rule made money.
My read: if there’s an edge, it lives in illiquid, mispriced books. Where there’s liquidity, the market already knows what the model knows. No order code exists in the project; everything here is paper.
What didn’t work
- Retraining every season didn’t fix the 2024–25 drift. The error just moved between seasons; year-to-year tempo shifts aren’t predictable from last year.
- Points per game stayed about 3 low until an end-of-half fix for two-minute-drill play calling. That fix made the pass/rush split worse, so it’s off by default.
- An explicit timeout model fixed the end of the second half but lowered scoring overall, so it’s off too.
The repo has a long paper (paper/paper.md) where every number points at the file that produced it, plus the drift, player and live-recording notes in docs/.