project writeup · october 2026 · 7 min read
HospitalGym: an emergency department rebuilt from public data, then searched for better plans
I built a working model of the emergency department at Robert Wood Johnson University Hospital in New Brunswick from federal datasets, calibrated it until it reproduced the hospital’s own published figures, and searched thousands of simulated hospitals for staffing and capacity plans that do better. This is what it found, what broke, and what didn’t work.
Every result here is simulated. This is a model built from public information. It is not affiliated with or endorsed by RWJUH or RWJBarnabas Health, and nothing has been validated against the hospital’s operational data. Staff names in the app are fictional.
Those compare one tuned plan against the calibrated baseline on simulated patients the search never saw: 24 versions of the twin, 32 seeds each, 30 days, paired on identical arrivals. The improvement held in 20 of the 24.
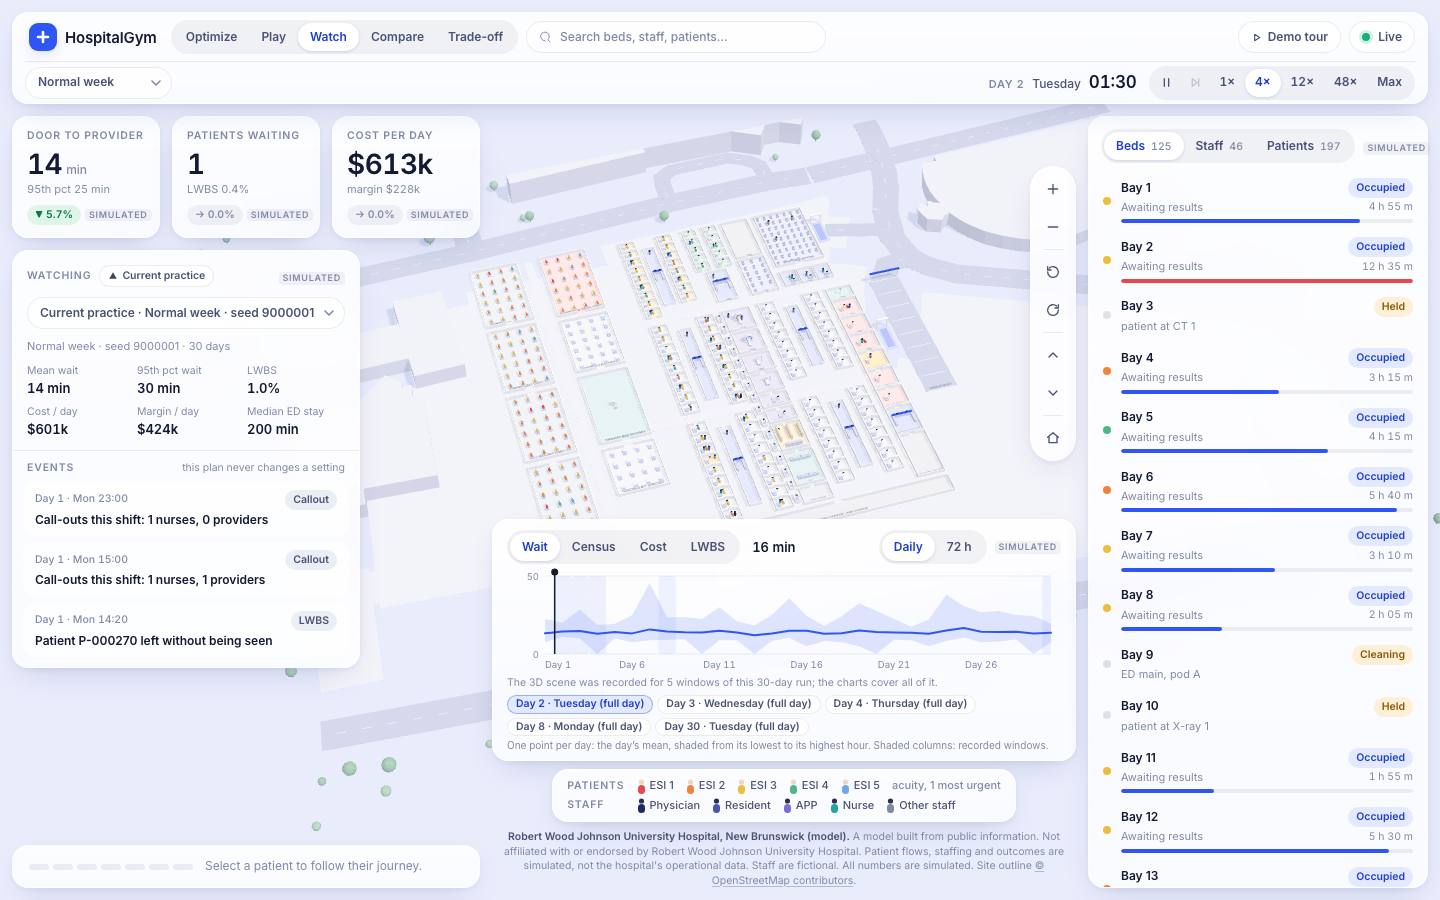
The idea
Warehouses and logistics networks are run with a loop: build a digital twin of the operation, simulate it many times, optimize the decisions that shape it. Emergency departments make the same kind of decisions every day (how many providers on each shift, when to open fast track or hallway overflow, when to call someone in, when to start discharge rounds) mostly from experience, because the effects interact over hours and days and can’t be tested on real patients.
A calibrated copy changes that. A plan can be tried on thousands of simulated days, against exactly the same stream of patients as current practice, before anyone touches a schedule.
Building the twin with no data agreement
One command builds a hospital from its CMS Certification Number. It pulls the ED times and volumes the hospital reports to CMS, its Medicare cost report, its affiliated clinician roster, regional BLS wages, CDC survey microdata on 51,713 emergency visits, and the payment rules. Every number carries a source tag: measured, literature, or assumed.
For RWJ the hospital-specific layer has 129 attributes: 89 measured, 6 from literature, 34 assumed. The assumed share is the honest ceiling on how good a public-data twin can be, and it’s exactly what the hospital’s own data would replace.
Does the baseline actually match the hospital?
An improvement is only as credible as the baseline it’s measured against, so before any optimization I fitted only the assumed parameters (shift head-counts, two service times, inpatient load) until the model’s ordinary day reproduced RWJ’s published figures. Checked on 64 held-out simulated hospitals over 60 days:
| Measure | Published | Twin | Result |
|---|---|---|---|
| Median ED time, discharged patients | 206 min | 203 min | inside range |
| Left without being seen | 1% | 0.91% | inside range |
| ED salaries per day | $65.9k | $61.6k | inside range |
| Inpatient occupancy, modeled beds | ~85% (HHS) | 84.4% | inside range |
| 90th-percentile wait, triage level 3 (national) | 118 min | 21 min | too short |
| Boarding time per admission (national) | 193 min | 23 min | too short |
The hospital’s own figures are reproduced. The national survey shapes aren’t all matched: the worst waits are too short and boarding is too light. Those are known weaknesses, and they’re in the report rather than hidden.
The bug that would have faked every result
The first fitted baseline matched the annual numbers on average but wasn’t stable. Over 60 simulated days its walk-out rate climbed from 0.9% to 3.4% and boarding went from 7 to 183 patient-hours a day: boarding lengthens inpatient stays, and with beds nearly full that feedback ran away. Any plan looks brilliant against a baseline sliding into gridlock. I lowered the modeled bed load until the baseline was steady, which also matches the occupancy the hospital reports in the federal weekly series.
Not one twin but 24
Many parameter settings reproduce the same published figures. Instead of pretending to know which one is right, I kept 24 well-spread settings out of 768 candidates. A plan only counts as an improvement together with the number of those twins it holds in.
Searching for a better plan
The simulator moves in five-minute ticks on PyTorch tensors: arrivals with triage level, condition and payer; triage, bays, provider encounters, labs and imaging, disposition; admitted patients waiting for an inpatient bed; staff who tire and call out; scanners that fail. It runs one hospital for the 3D viewer or thousands in parallel for search. A plan controls 22 settings at hourly, daily and weekly rhythms.
The headline objective is one a hospital could sign off on: same budget, better flow. Improve waits, length of stay, walk-outs and boarding, with hard limits that labor and staffed-space cost don’t rise, deaths, adverse events and the sickest patients’ waiting don’t get worse, and there’s no extra ambulance diversion or transfers out. Diversion and the admission cap are locked, because an earlier unconstrained optimizer learned to hit its target by diverting ambulances nearly all day.
A cross-entropy search tunes a rule-based plan (staffing per shift plus thresholds for call-ins, overflow, fast track and discharge rounds), then scores it once on fresh patients. Two machines tuned independently and landed on the identical plan.
- Evening providers go from 15 to 18; a third triage station is staffed nearly all the time; providers always take new patients first.
- Day-shift nurses go from 37 to 18. This is the part to distrust: nurses in the fitted model are busy about a third of the time because the model was fitted to a salary total, not to real workload. With real nurse staffing data this half of the result could change completely. The provider and triage findings rest on firmer ground.
- Under a flu surge the same plan cuts mean wait by 62.7%, but it transfers more patients out than the baseline, so it fails that constraint and holds in only 9 of 24 twins.
Pick your own goal
The Optimize page lets anyone rank their own goals (maximize, minimize, or ignore each of 16 measures) and launches a search, about four and a half minutes on a 96-core machine. Profit first, then wait, then a patient-experience proxy gave profit +1.8% and mean wait −29%, better in 6 of 6 twins.
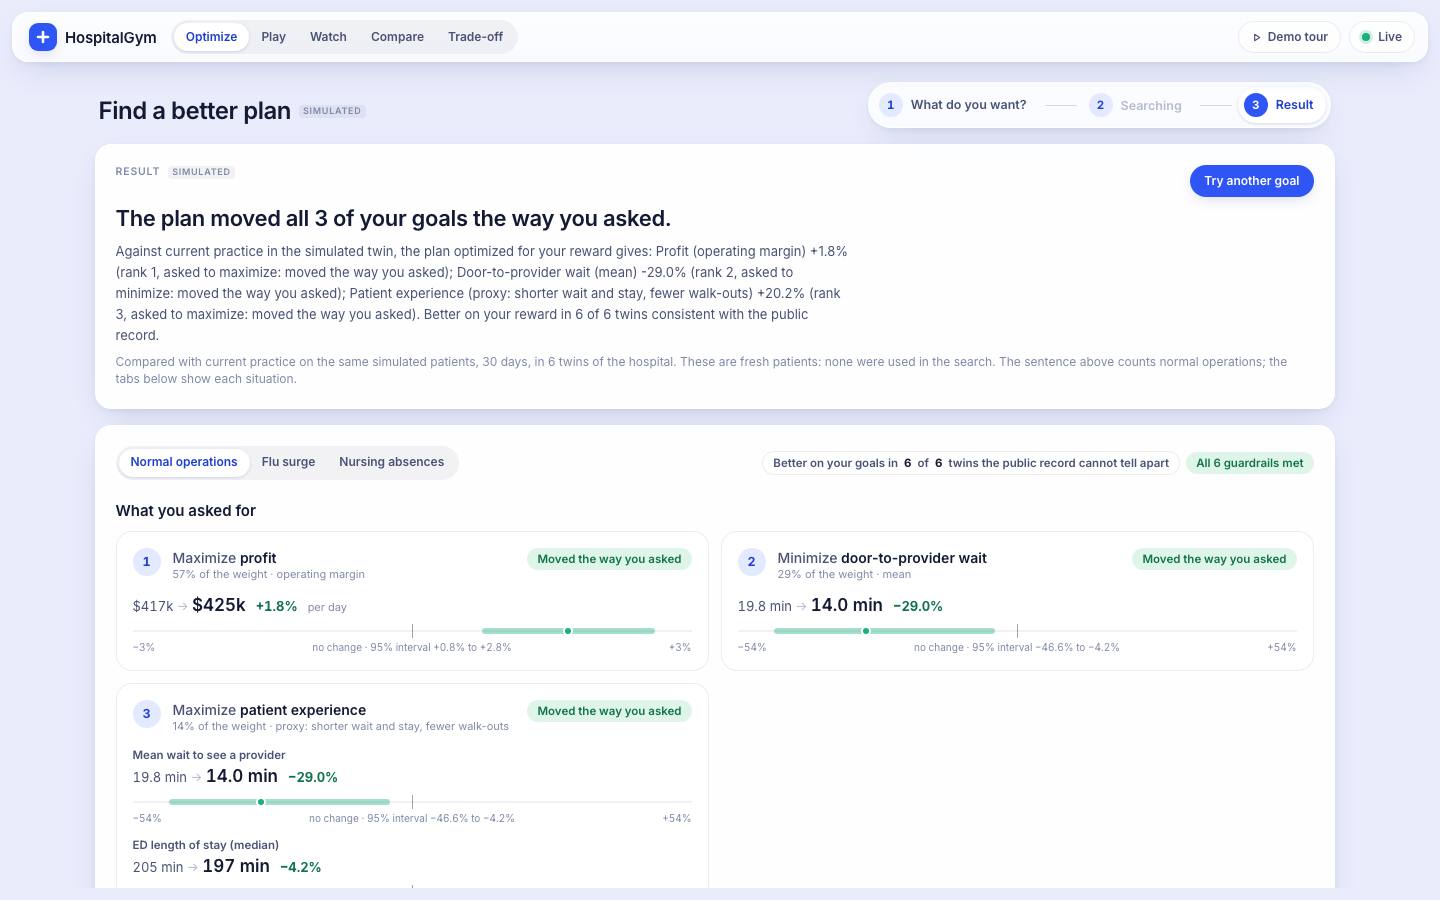
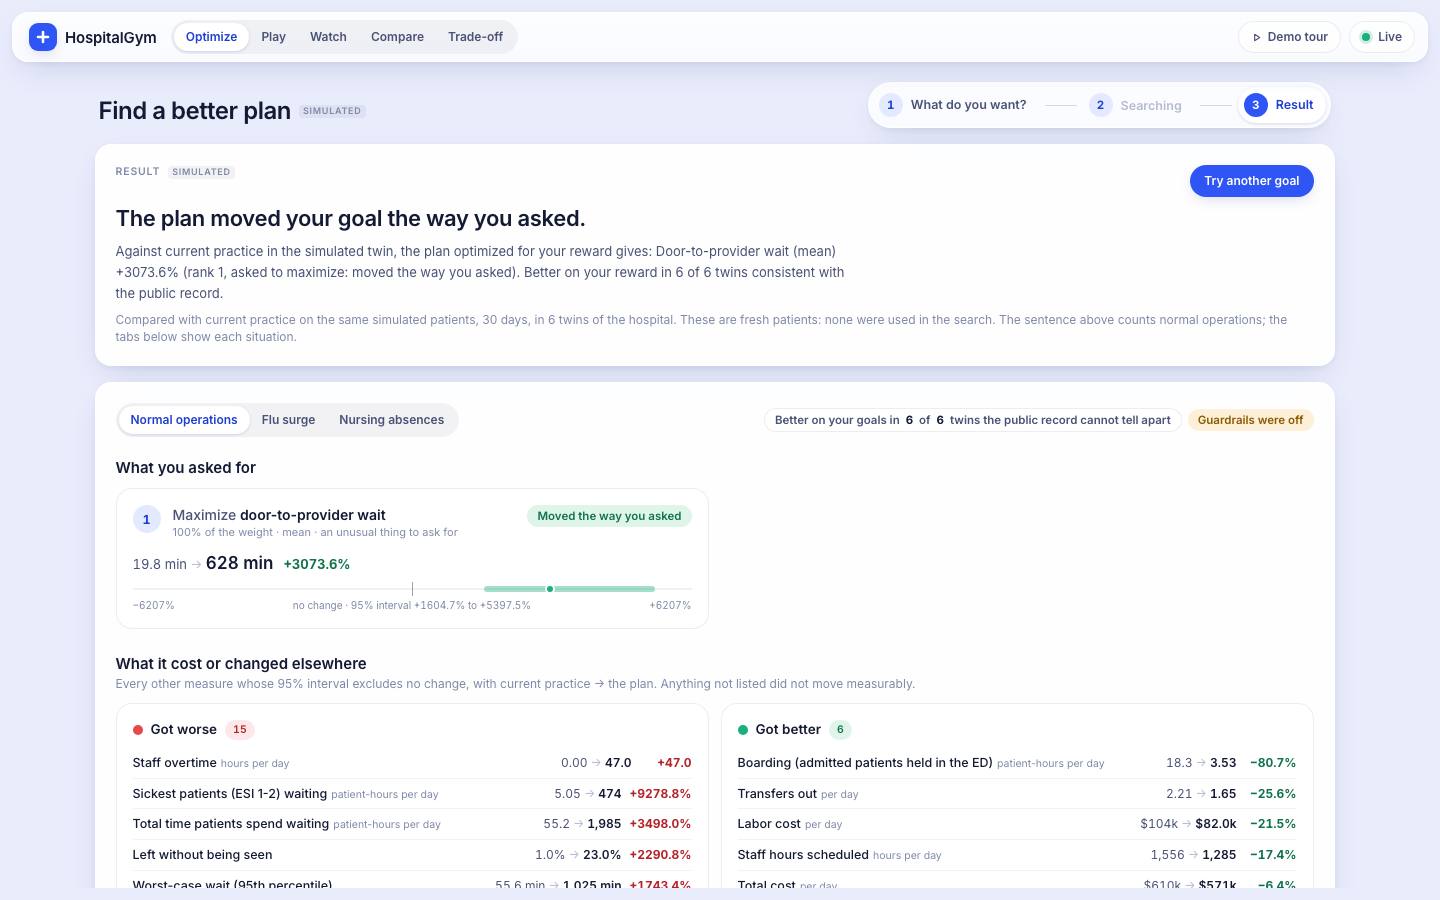
One design bug mattered for trust: the first ranking let a 31% drop in waiting pay for a 2.4% drop in profit even with profit ranked first, because waiting can move much further in percentage terms. Goals are now scaled by how far each can realistically move.
What each resource is worth
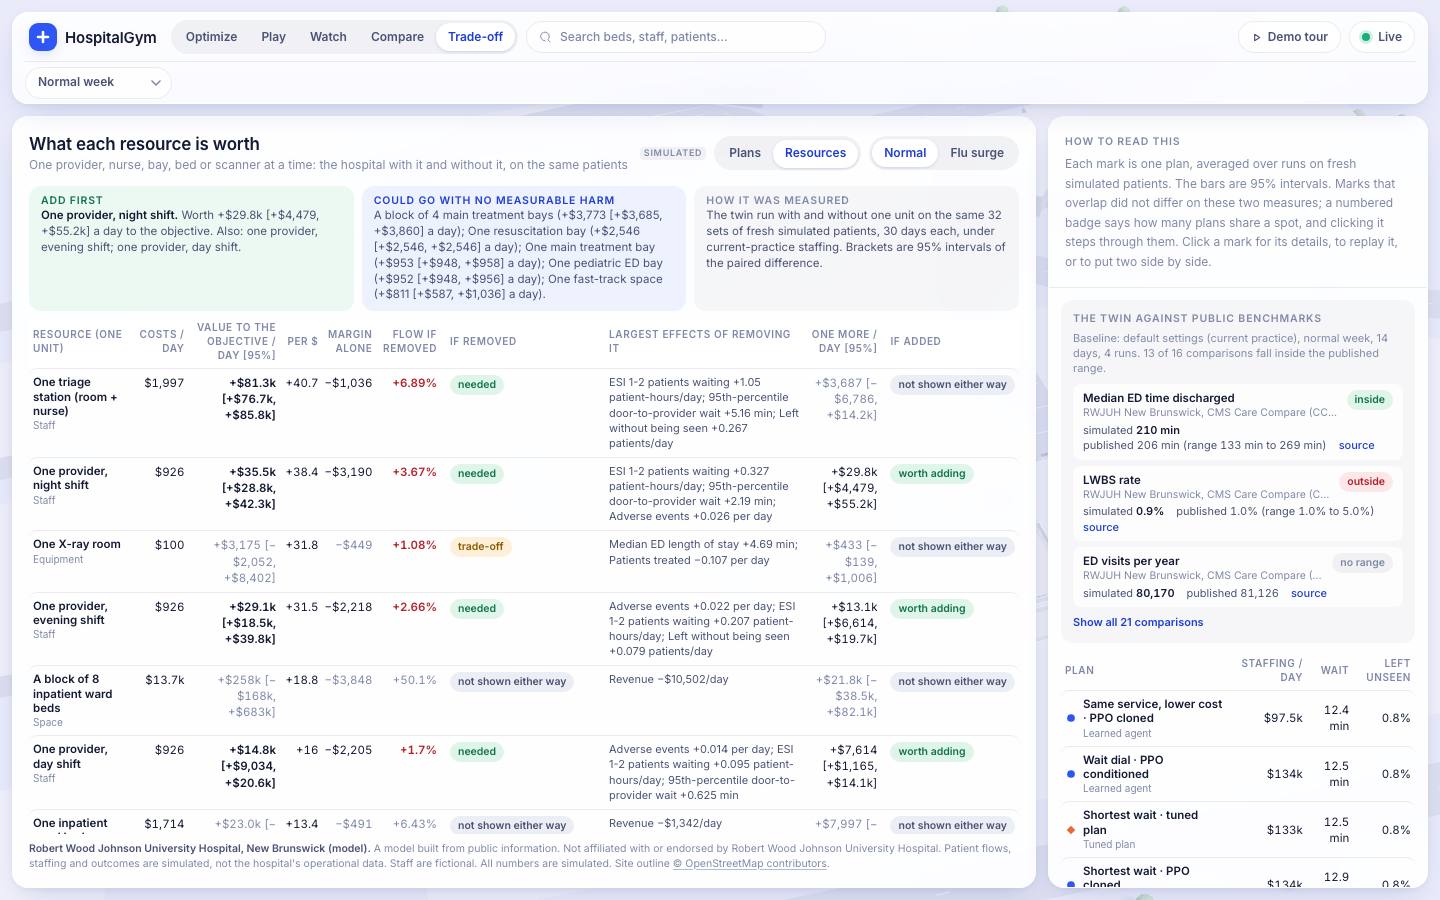
Because the simulator can replay identical patients, it can answer “what is one more of this worth?” directly: run the twin with one unit removed and one added, on the same 32 sets of patients. A triage station came out as the most valuable single unit; a night provider is the first to add; closing fast track helps on a normal week and hurts in a surge.
What didn’t work
- PPO didn’t beat the tuned rules. Neural agents trained with PPO over the 22 settings matched the tuned rule-based plans but didn’t beat them, and lost on the same-budget objective. The decisions are mostly a handful of slow settings, which a compact rule already covers.
- Same service at lower cost failed its cost constraint on fresh patients in all 24 twins. There’s no result to report for that objective.
- A learned “who is seen next” rule beat the best fixed queue rule on flow, but in a flu surge it raised deaths by 0.94 per 10,000 arrivals and failed the safety constraints: the gain came from letting a tail of patients wait. That direction needs a model where patients within a triage level actually differ.
What real data would unlock
The pipeline is built so hospital data replaces assumptions one at a time, and each replacement can be checked: de-identified ED timestamps for an hour-by-hour baseline, real staffing schedules to settle the nurse question, bed-management data for a real model of boarding (the largest lever in the current results), and per-visit triage, complaint and age. The same command already builds Mount Sinai and Mayo Clinic Rochester, uncalibrated.
Every data source and the full calibration table are in the repo, with the generated reports behind every number under twin/reports/rwjuh_nb/ and rl/hospitals/rwjuh_nb/.
I’m looking for full-time work in San Francisco from January to May 2027, on RL environments, evals, simulation and agents. Here’s how to reach me.