project writeup · october 2026 · 6 min read
RL Trading Swarm: a closed simulated economy for testing policies and training trading agents
A market where every dollar and every share is accounted for: five companies, options, treasury bonds, a central bank and a treasury, an evolving population of neural-network traders, and fundamentalist and trend-following traders that produce realistic price behavior. I use it to run policy shocks with proper statistics and to train RL agents.
What’s in the economy
One tick is one trading day. The population of neural-network traders evolves: agents pay operating costs that rise with how much data they subscribe to, and they die when they run out of cash, split when they get rich, and mutate. Alongside them are non-evolving fundamentalists and sentiment traders that switch strategies based on recent performance (Brock–Hommes), plus noise traders and market makers. A central bank follows a Taylor rule with QE at the lower bound, and a treasury runs bond auctions, stimulus and tax. Every tick in debug mode checks that money and shares are conserved.
Getting it to look like a market
The first version was a working economy with unrealistic prices: daily kurtosis in the thousands, stocks moving 3–12% a year, and prices that ignored fundamentals. The fixes were mostly accounting:
- Fundamental value became the present value of the expected earnings path, with permanent earnings shocks. Before, it capitalized fast-mean-reverting earnings and swung 66–106% a year.
- Buybacks were swept through thin books at 20× earnings, which caused +48% one-day spikes. Now they’re capped near the last price and at 25% of average daily volume, like SEC Rule 10b-18.
- The cost index tracked money per living agent, so population growth looked like deflation and pinned rates at zero. It now tracks aggregate money supply.
- The fundamentalist and sentiment traders were added so prices respond to value at all.
Now annual volatility is 25–33%, daily kurtosis 4–9, there’s no return autocorrelation at lags 1–5, and volatility shows long memory. These facts come from traders I designed, not from emergent behavior, and I don’t claim otherwise.
Policy experiments
A scenario is a YAML file with timed interventions. Each runs on 8 or more seeds, paired against a baseline on the same seeds, because a single run of a chaotic market proves nothing.
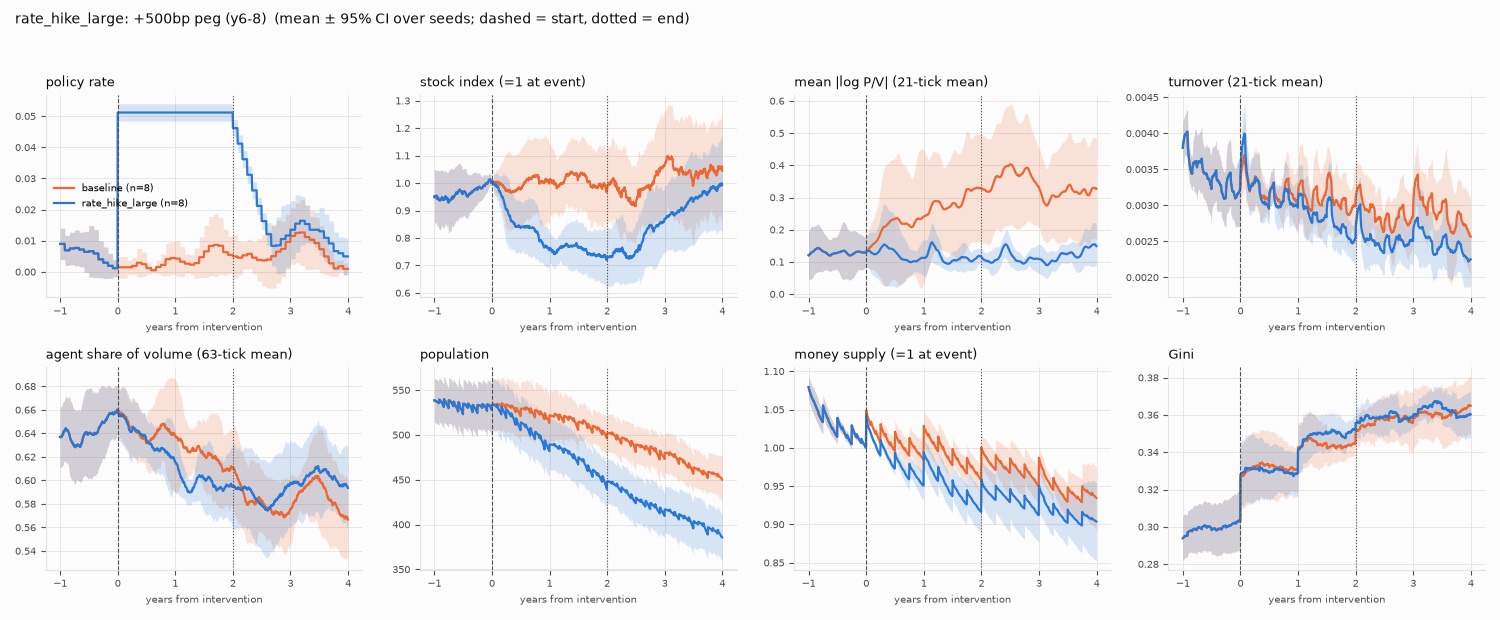
| Shock | Index response | Other effects |
|---|---|---|
| Permanent earnings −30% | −21% in a year (p < 0.001) | The rate rule cuts |
| +300bp rate peg, 2 years | −23% (p = 0.002) | Population −46 |
| +500bp rate peg, 2 years | −30% (p = 0.002) | Population −57 |
| Zero-rate peg, 5 years | +9% (p < 0.001) | Wider price-to-value gap |
| Helicopter money | Not significant | Money +12%; the rule hikes to 2.4% |
| Tobin tax 10–50bp | No turnover effect | Volatility 29% → 27% at 50bp |
The biggest agent-side lever turned out to be the price of information. Tripling data costs nearly halves the population and lets mispricing last longer.
Training an agent
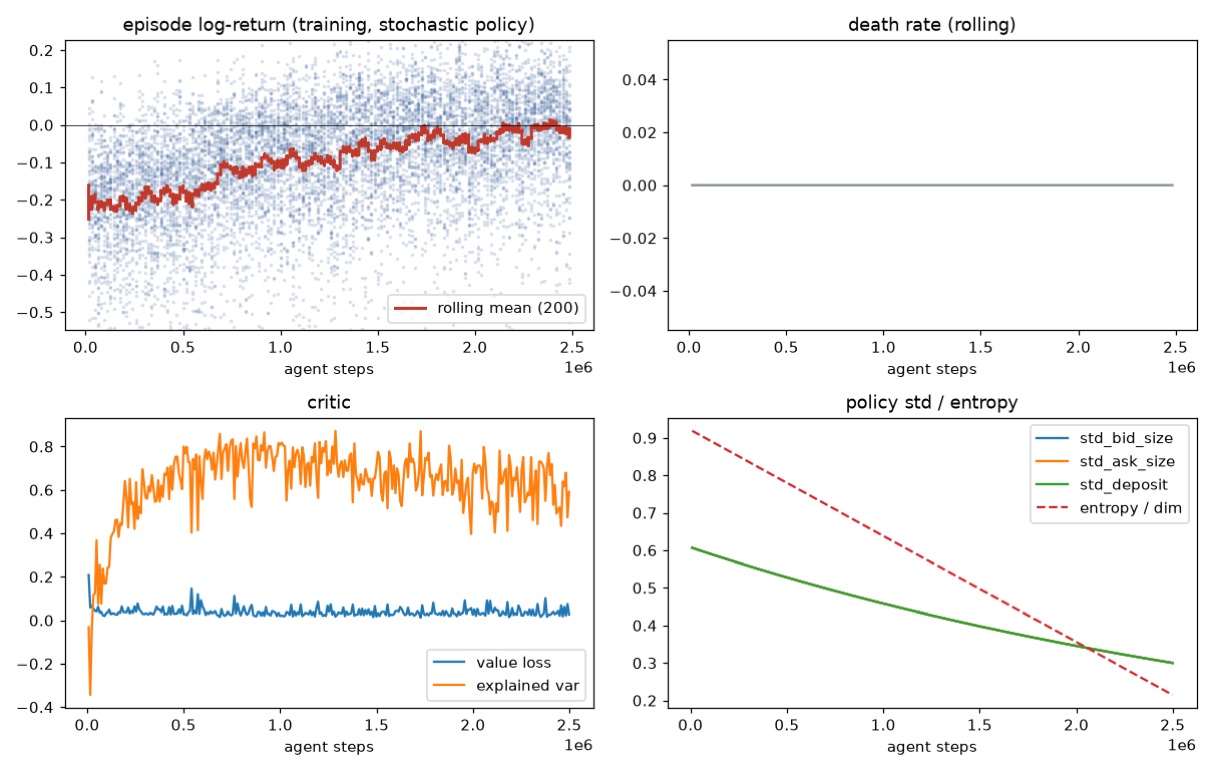
The environment is a PettingZoo parallel env: my policy controls a few rows of the population and everyone else runs internally. The policy is a permutation-equivariant actor-critic trained with PPO on deepstack’s GPU, evaluated on 48 held-out seeds against random, do-nothing, buy-and-hold, a P/E fundamental rule and the evolved population.
With normal costs, PPO beat every baseline, but every policy lost money: operating costs are about 13% of median wealth a year, so survival dominated the reward. With the controlled agents exempt from operating costs, PPO made +7.1% a year at a Sharpe of 1.7 and still beat everything. It holds about half its net worth in stocks, bids continuously near the reference price, writes options and quotes both sides of bonds. Its order flow is uncorrelated with lagged returns, so the edge looks like liquidity provision, not a leftover pattern in the simulator.
Known gaps
- Volume and volatility aren’t correlated the way they are in real markets. An optional news process fixes it on 5 of 8 seeds.
- Transaction taxes don’t reduce turnover, which they should.
- The population drifts down slowly after year 6.
- Part of the price-to-value response to rate shocks is mechanical, because value discounts at the policy rate.
The repo has the design spec (plan.md), every deviation from it (DECISIONS.md), and the evidence for each claim here (REALISM.md, CALIBRATION.md).
I’m looking for full-time work in San Francisco from January to May 2027, on quant research and engineering, RL environments and evals, and agents. Here’s how to reach me.